> ## Documentation Index
> Fetch the complete documentation index at: https://private-7c7dfe99-detect-table-modification.mintlify.site/llms.txt
> Use this file to discover all available pages before exploring further.

> Draxlr is a Business intelligence tool with data visualization and analytics.

# Connecting Draxlr to ClickHouse

export const CommunityMaintainedBadge = () => {
  return <div className="CommunityMaintainedBadge">
            <div className="CommunityMaintainedIcon">
            <svg xmlns="http://www.w3.org/2000/svg" width="20" height="20" fill="currentColor" viewBox="0 0 256 256">
                <path d="M244.8,150.4a8,8,0,0,1-11.2-1.6A51.6,51.6,0,0,0,192,128a8,8,0,0,1-7.37-4.89,8,8,0,0,1,0-6.22A8,8,0,0,1,192,112a24,24,0,1,0-23.24-30,8,8,0,1,1-15.5-4A40,40,0,1,1,219,117.51a67.94,67.94,0,0,1,27.43,21.68A8,8,0,0,1,244.8,150.4ZM190.92,212a8,8,0,1,1-13.84,8,57,57,0,0,0-98.16,0,8,8,0,1,1-13.84-8,72.06,72.06,0,0,1,33.74-29.92,48,48,0,1,1,58.36,0A72.06,72.06,0,0,1,190.92,212ZM128,176a32,32,0,1,0-32-32A32,32,0,0,0,128,176ZM72,120a8,8,0,0,0-8-8A24,24,0,1,1,87.24,82a8,8,0,1,0,15.5-4A40,40,0,1,0,37,117.51,67.94,67.94,0,0,0,9.6,139.19a8,8,0,1,0,12.8,9.61A51.6,51.6,0,0,1,64,128,8,8,0,0,0,72,120Z"></path>
            </svg>
        </div>
            Community Maintained
        </div>;
};

export const Image = ({img, alt, size = "lg"}) => {
  const normalizedSize = ["sm", "md", "lg"].includes(size) ? size : "lg";
  return <div className={`ch-image-${normalizedSize}`}>
      <Frame>
        <img src={img} alt={alt} />
      </Frame>
    </div>;
};

Draxlr offers an intuitive interface for connecting to your ClickHouse database, enabling your team to explore, visualize, and publish insights within minutes. This guide will walk you through the steps to establish a successful connection.

<Steps>
  <Step title="Get your ClickHouse credentials" id="1-get-your-clickhouse-credentials">
    To connect to ClickHouse with HTTP(S) you need this information:

    | Parameter(s)              | Description                                                                                                    |
    | ------------------------- | -------------------------------------------------------------------------------------------------------------- |
    | `HOST` and `PORT`         | Typically, the port is 8443 when using TLS or 8123 when not using TLS.                                         |
    | `DATABASE NAME`           | Out of the box, there is a database named `default`, use the name of the database that you want to connect to. |
    | `USERNAME` and `PASSWORD` | Out of the box, the username is `default`. Use the username appropriate for your use case.                     |

    The details for your ClickHouse Cloud service are available in the ClickHouse Cloud console.
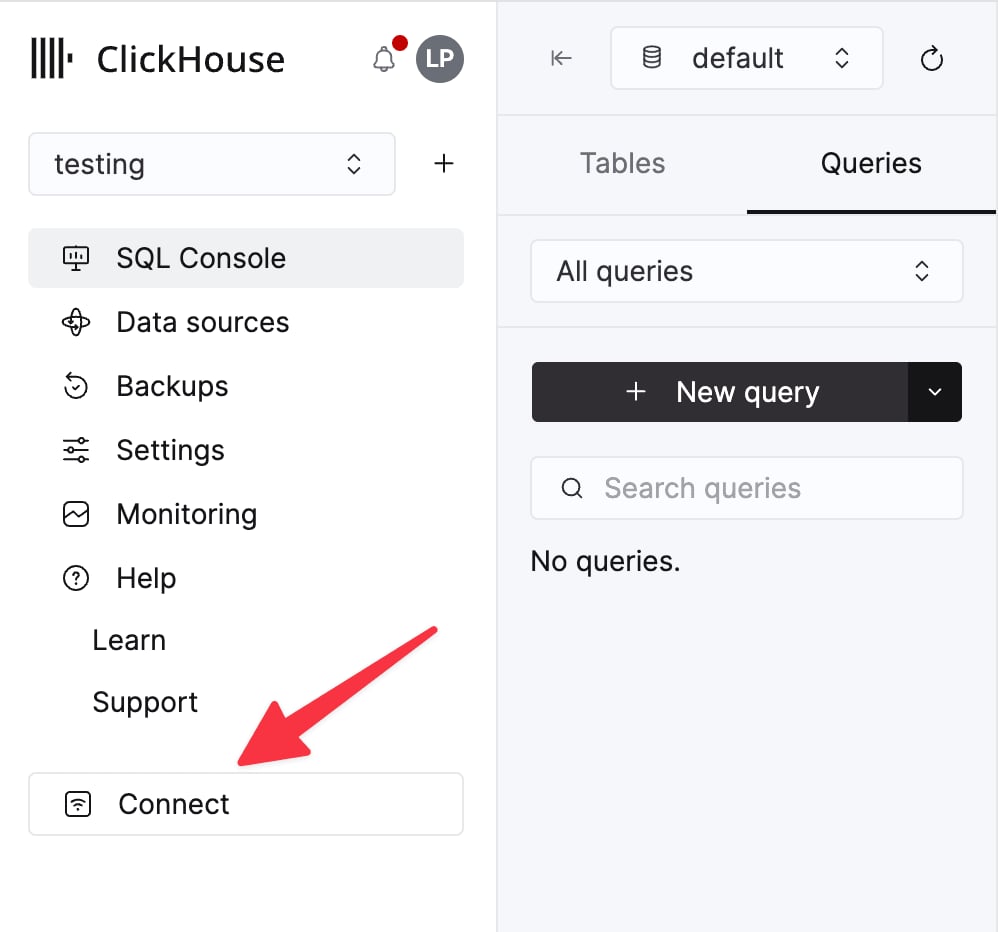
    Select a service and click **Connect**:

    <div className="ch-image-md">
      <Frame>
        <img src="https://mintcdn.com/private-7c7dfe99-detect-table-modification/0yJtAU6cqYAQlCWC/images/_snippets/cloud-connect-button.webp?fit=max&auto=format&n=0yJtAU6cqYAQlCWC&q=85&s=2d1e2340e1ddccf3199ca1e41eeba836" alt="ClickHouse Cloud service connect button" width="998" height="932" data-path="images/_snippets/cloud-connect-button.webp" />
      </Frame>
    </div>

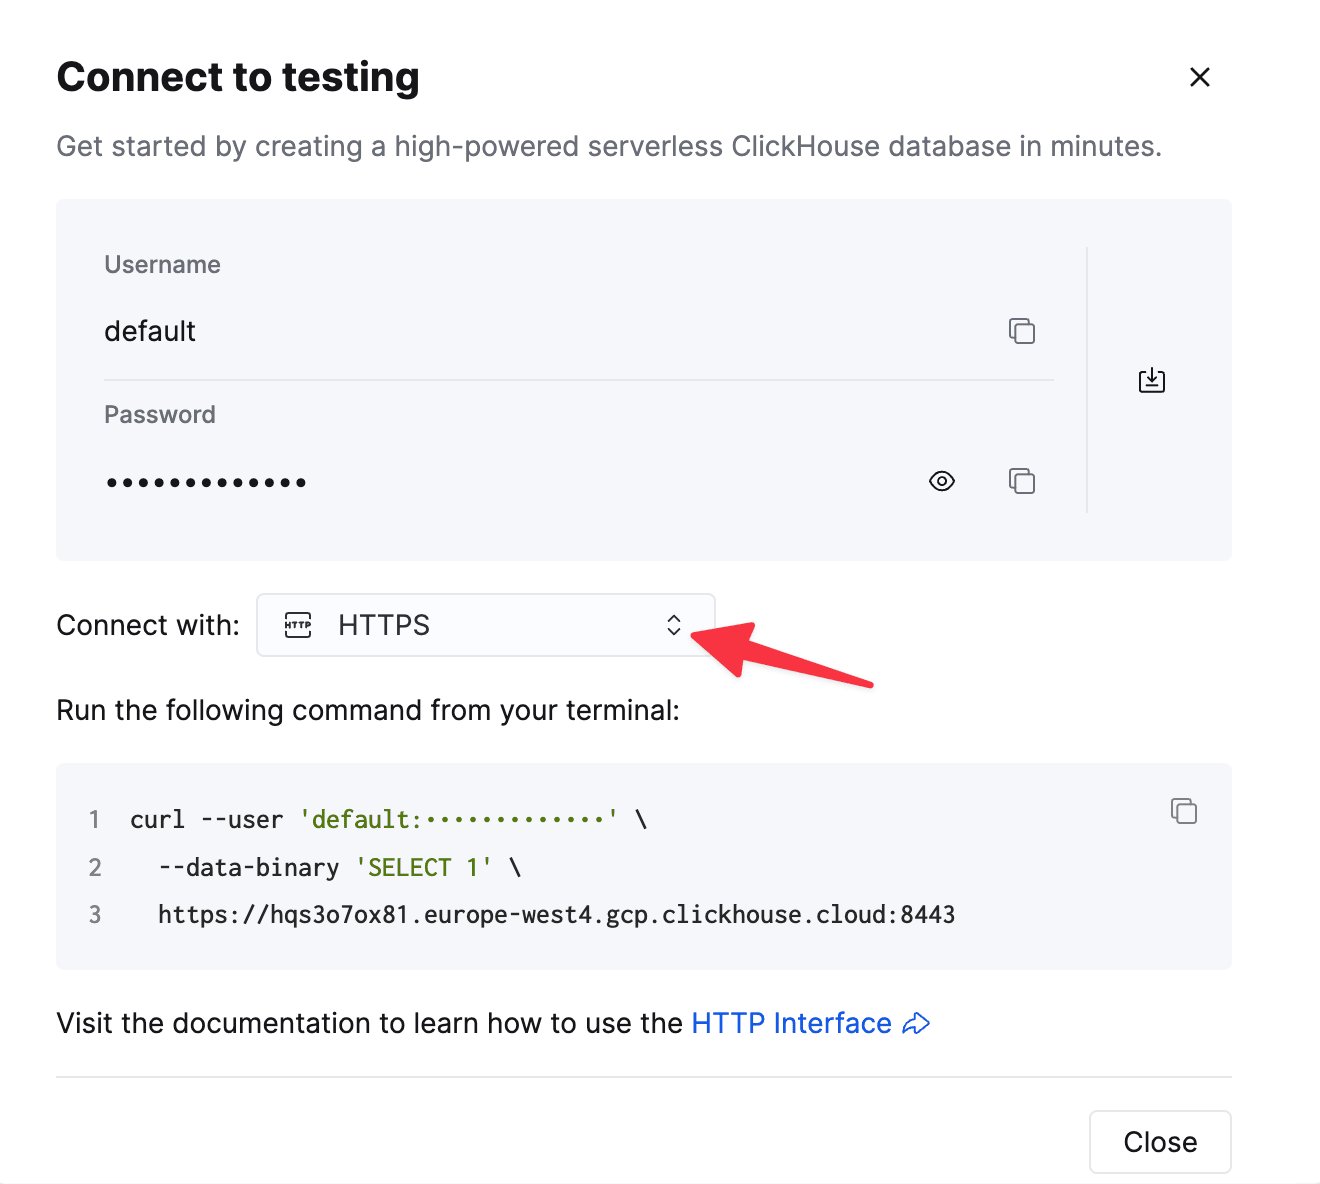
    Choose **HTTPS**. Connection details are displayed in an example `curl` command.

    <div className="ch-image-md">
      <Frame>
        <img src="https://mintcdn.com/private-7c7dfe99-detect-table-modification/0yJtAU6cqYAQlCWC/images/_snippets/connection-details-https.webp?fit=max&auto=format&n=0yJtAU6cqYAQlCWC&q=85&s=2ea2af378046d5ec87ea8e78de573bc1" alt="ClickHouse Cloud HTTPS connection details" width="1320" height="1184" data-path="images/_snippets/connection-details-https.webp" />
      </Frame>
    </div>

    If you're using self-managed ClickHouse, the connection details are set by your ClickHouse administrator.
  </Step>

  <Step title="Connect Draxlr to ClickHouse" id="2--connect-draxlr-to-clickhouse">
    1. Click on the **Connect a Database** button on the navbar.

    2. Select **ClickHouse** from the list of available databases and click next.

    3. Choose one of the hosting services and click next.

    4. Use any name in the **Connection Name** field.

    5. Add the connection details in the form.

    <Image size="md" img="https://mintcdn.com/private-7c7dfe99-detect-table-modification/L7_COrR7NltKl_Va/images/integrations/data-visualization/draxlr_01.webp?fit=max&auto=format&n=L7_COrR7NltKl_Va&q=85&s=9f908b2eb64c3f8e85e0e819ac538e82" alt="Draxlr connection form showing ClickHouse database configuration options" border width="1798" height="1266" data-path="images/integrations/data-visualization/draxlr_01.webp" />

    6. Click on the **Next** button and wait for the connection to be established. You will see the tables page if the connection is successful.
  </Step>

  <Step title="Explore your data" id="4-explore-your-data">
    1. Click on one of the tables in the list.

    2. It will take you to the explore page to see the data in the table.

    3. You can start adding the filters, make joins and add sort to your data.

    <Image size="md" img="https://mintcdn.com/private-7c7dfe99-detect-table-modification/L7_COrR7NltKl_Va/images/integrations/data-visualization/draxlr_02.webp?fit=max&auto=format&n=L7_COrR7NltKl_Va&q=85&s=970294a65e16e06d7bf08fc381670a9d" alt="Draxlr data exploration interface showing filters and sorting options" border width="2746" height="1492" data-path="images/integrations/data-visualization/draxlr_02.webp" />

    4. You can also use the **Graph** button and select the graph type to visualize the data.

    <Image size="md" img="https://mintcdn.com/private-7c7dfe99-detect-table-modification/L7_COrR7NltKl_Va/images/integrations/data-visualization/draxlr_05.webp?fit=max&auto=format&n=L7_COrR7NltKl_Va&q=85&s=66da22ce98ac71d1b4ab3248032ce281" alt="Draxlr graph visualization options for ClickHouse data" border width="2744" height="1496" data-path="images/integrations/data-visualization/draxlr_05.webp" />
  </Step>

  <Step title="Using SQL queries" id="4-using-sql-queries">
    1. Click on the Explore button on the navbar.

    2. Click the **Raw Query** button and enter your query in the text area.

    <Image size="md" img="https://mintcdn.com/private-7c7dfe99-detect-table-modification/L7_COrR7NltKl_Va/images/integrations/data-visualization/draxlr_03.webp?fit=max&auto=format&n=L7_COrR7NltKl_Va&q=85&s=23a6de714d09d9c3399acaaf23a902e2" alt="Draxlr SQL query interface for ClickHouse" border width="916" height="128" data-path="images/integrations/data-visualization/draxlr_03.webp" />

    3. Click on the **Execute Query** button to see the results.
  </Step>

  <Step title="Saving you query" id="4-saving-you-query">
    1. After executing your query, click on the **Save Query** button.

    <Image size="md" img="https://mintcdn.com/private-7c7dfe99-detect-table-modification/L7_COrR7NltKl_Va/images/integrations/data-visualization/draxlr_04.webp?fit=max&auto=format&n=L7_COrR7NltKl_Va&q=85&s=202224a651cd9cd910c3411a1b4910d7" alt="Draxlr save query dialog with dashboard options" border width="2748" height="1490" data-path="images/integrations/data-visualization/draxlr_04.webp" />

    2. You can name to query in **Query Name** text box and select a folder to categories it.

    3. You can also use **Add to dashboard** option to add the result to dashboard.

    4. Click on the **Save** button to save the query.
  </Step>

  <Step title="Building dashboards" id="5-building-dashboards">
    1. Click on the **Dashboards** button on the navbar.

    <Image size="md" img="https://mintcdn.com/private-7c7dfe99-detect-table-modification/L7_COrR7NltKl_Va/images/integrations/data-visualization/draxlr_06.webp?fit=max&auto=format&n=L7_COrR7NltKl_Va&q=85&s=4eb2c58226f21331106702058085e000" alt="Draxlr dashboard management interface" border width="2744" height="1484" data-path="images/integrations/data-visualization/draxlr_06.webp" />

    2. You can add a new dashboard by clicking on the **Add +** button on the left sidebar.

    3. To add a new widget, click on the **Add** button on the top right corner.

    4. You can select a query from the list of saved queries and choose the visualization type then click on the **Add Dashboard Item** button.
  </Step>
</Steps>

<h2 id="learn-more">
  Learn more
</h2>

To know more about Draxlr you can visit [Draxlr documentation](https://draxlr.notion.site/draxlr/Draxlr-Docs-d228b23383f64d00a70836ff9643a928) site.