

- Automatic scaling of compute, independent of storage
- Low-cost and effectively unlimited retention based on object storage
- Independent isolation of read and write workloads with warehouses
- Integrated authentication
- Automated backups
- Security and compliance features
- Seamless upgrades
Before you begin
You can also send data directly to ClickHouse using a supported integration and your own schema.Create a ClickHouse Cloud service
Complete Create a ClickHouse service in the ClickHouse Cloud quickstart. Before continuing, confirm that the service is running.Prepare your ingestion environment
- To start a new OpenTelemetry Collector, install Docker. For Kubernetes, deploy the collector with Helm.
- To use an existing collector, run it in the gateway role and ensure that its distribution includes the ClickHouse exporter. You will add the required configuration in this guide.
Set up Managed ClickStack
Choose an ingestion source and collector setup
From your ClickHouse Cloud service, launch ClickStack. On the ClickStack Getting Started page, select Start ingestion.On the Choose an ingestion source page, select OpenTelemetry.
OpenTelemetry recommendedOpenTelemetry provides preconfigured schemas for logs, traces, metrics, and sessions.
- Start a new collector
- Use an existing collector
ClickStack generates the collector command with the
To continue with the Replace
default administrator credentials. We recommend dedicated ingestion credentials to keep ingestion access separate from administration and avoid relying on the administrator password.Create dedicated ingestion credentials (recommended)
Create dedicated ingestion credentials (recommended)
In ClickHouse Cloud, open your service’s SQL console and run:In the generated command, replace
CLICKHOUSE_USER="default" with CLICKHOUSE_USER="clickstack-ingest" and set CLICKHOUSE_PASSWORD to the dedicated user’s password.default administrator credentials, copy the command from the Start Collector tab. ClickStack pre-populates the service endpoint. Replace the password placeholder with your service password. If you no longer have it, gather or reset your connection details.The command follows this format:<host> and <your_password_here> with the values for your ClickHouse Cloud service, then run the command.The collector runs in the foreground. Leave this terminal open and use a second terminal for the remaining commands in this guide.This command exposes the OTLP ports without authentication and is intended for local evaluation. Before sending production traffic, secure the collector.
Send test data
Send a test log with the current timestamp:If you use an existing collector, replace
http://localhost:4318 with its OTLP HTTP endpoint. If the receiver requires authentication, add the required header to the curl command.A successful request returns HTTP/1.1 200 OK.Next steps
If another guide requires your ClickHouse Cloud endpoint or password, gather or reset your connection details before continuing.Send application and infrastructure data
Choose a guide for the data that you want to send to ClickStack:Instrument an application
Send application traces and logs with a supported OpenTelemetry SDK.
Collect host logs
Forward host logs from an OpenTelemetry Collector running in the agent role.
Monitor Kubernetes
Collect logs, metrics, and traces from a Kubernetes cluster.
Explore other integrations
Find guides for additional applications and telemetry sources.
Explore sample data
Use a sample dataset to explore ClickStack with richer telemetry:Sample logs, traces, and metrics
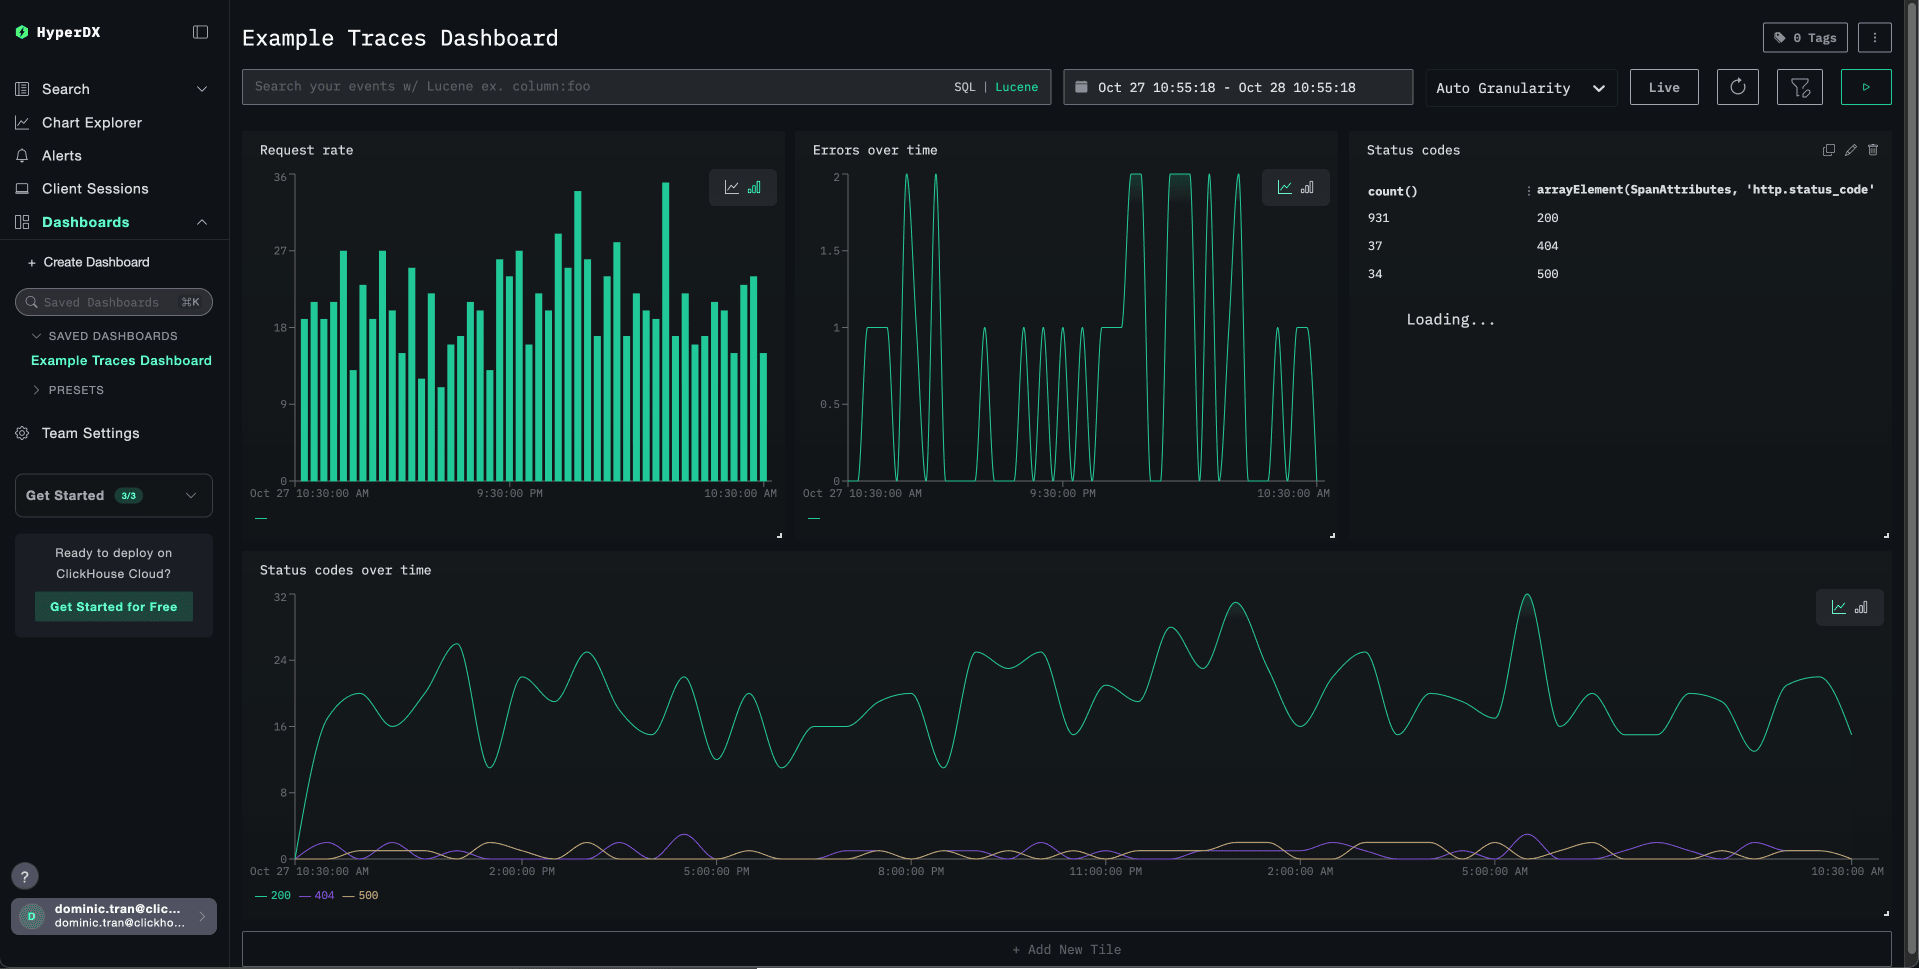
Local logs and metrics
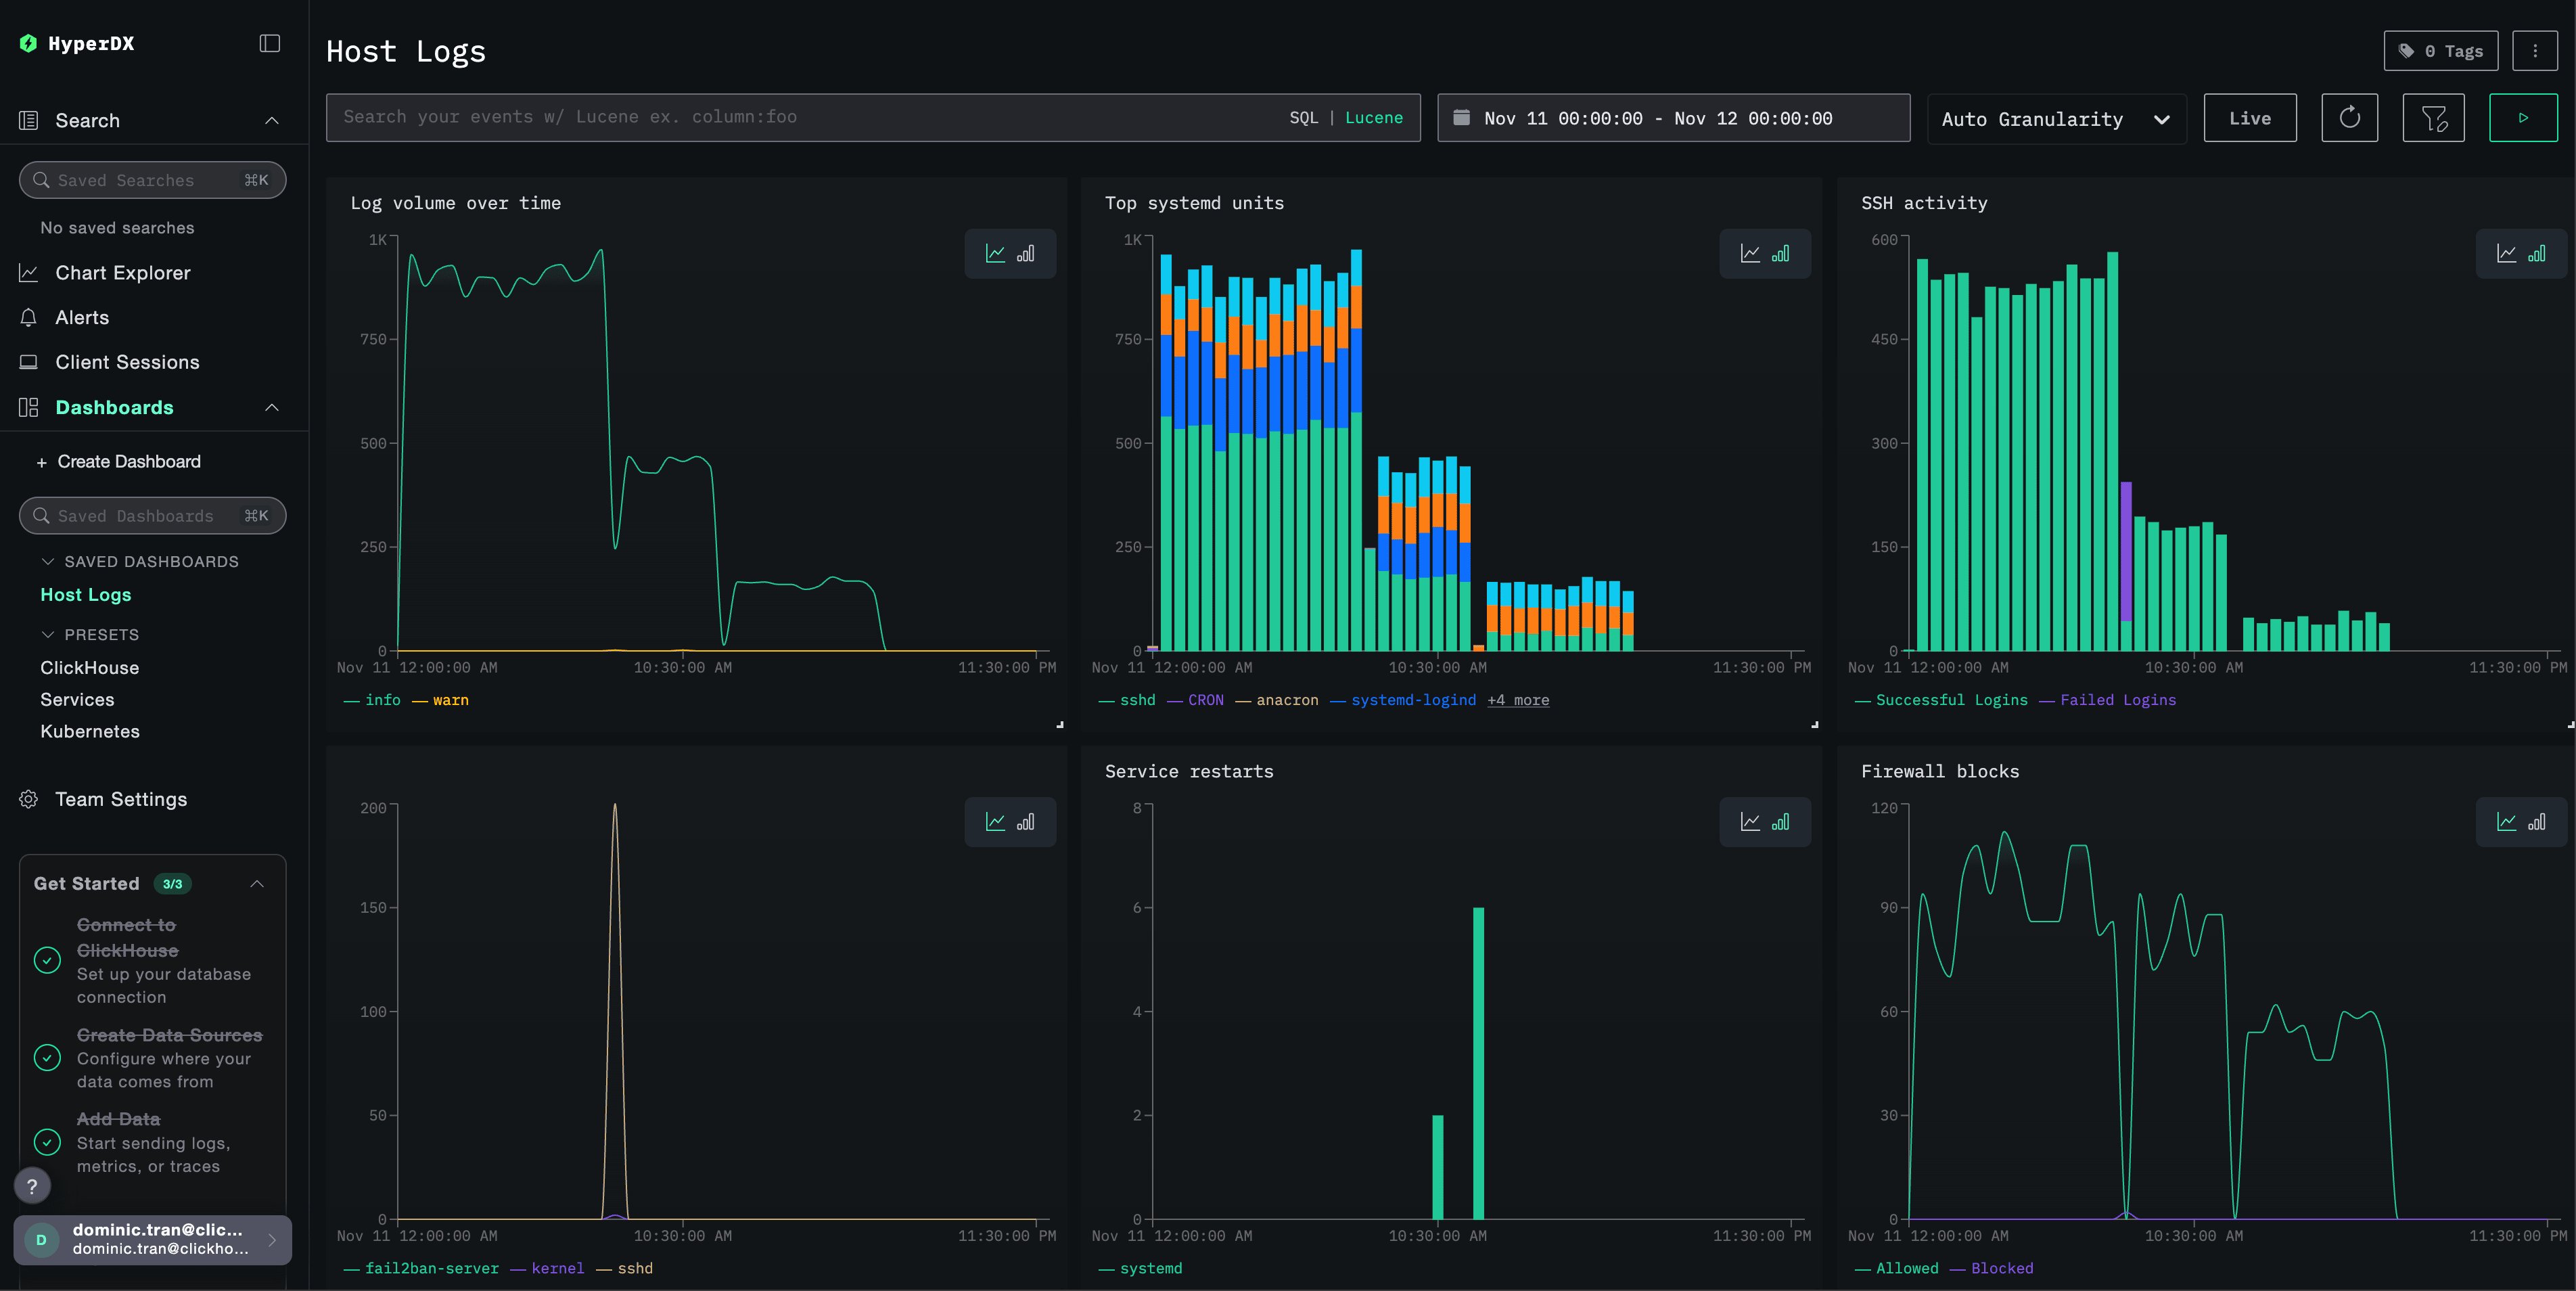
Generate synthetic data
Use a generator to test ingestion without an existing application or dataset:Generate data with otelgen
Send a short burst of synthetic OTLP logs, traces, and metrics.
Generate data with telemetrygen
Generate configurable OpenTelemetry signals across several services.
Prepare for production
Review production and sizing guidance before using ClickStack for sustained workloads:Going to production
Review ingestion credentials, security, retention, and operational guidance.
Estimate resources
Size compute for your expected ingest volume.